MBS Bonds - 10Y Rate Moved 72bps Last Week. Do You Know What Your Delta Is?
April 14, 2025
Last week, the 10-year rate moved from an intraday low of 3.87% on Monday to intraday high of 4.59% on Friday – a 72 basis point increase. This selloff widened the current coupon spread, causing the current coupon rate to sell off by more than 80 basis points. Optimal Blue (OB30C) PMMS futures also sold off about 50 bps WOW. Given ongoing economic uncertainty, this interest rate volatility is likely to continue.
As all mortgage traders know, buying a cheap asset is only the first step in making money – the second is being able to hedge it accurately. Accurate hedging is especially critical in the current environment of high interest rate volatility.
How do mortgage traders calculate the delta of MBS bonds?
There are several approaches:
- Trader Hedge Ratios – Derived from consensus among dealers on what TBA hedge ratios should be.
- Empirical – Derived through statistical analysis (typically linear regressions) of price vs. rate partials and current coupon spreads.
- Prepayment Models – Sophisticated off-the-shelf (or custom-calibrated) models based on analysts' subjective assumptions and historical data.
- No-Model Data-Driven – Derived directly from the data using econometric methods, without relying on models.
Methods 1 and 2 are applicable primarily to very liquid and generic bonds such as TBAs or Spec Pools. For less generic and more structured products – like Agency Derivatives (IOs, IIOs), CMOs, and MSRs – only Methods 3 and 4 are viable.
While there are many advanced Prepayment Models available for calculating MBS bond deltas, they often function as 'black boxes' with non-intuitive results – leading to questions such as:
- How can I intuitively explain the delta from a Prepayment Model?
- What if different Prepayment Models show contradictory results? Can they all be right? Can they all be wrong?
- Why did my delta change with a new Prepayment Model version? Was the previous version correct? Is the current one correct? What about future versions?
- Why didn't my Prepayment Model delta change in line with its convexity when rates moved?
- Why do my prepayment model OAS values change, even when I hedge using the model's greeks?
To address questions like these, we often calculate greeks using a No-Model Data-Driven approach. This method is both simple and intuitive. A fundamental way to calculate delta for any MBS bond is:
Where:
- Spread01 = Price sensitivity to interest rate shifts, assuming constant prepayments
- CCS01 = Price sensitivity to prepayment changes caused by interest rate shifts
- Index01 = Price sensitivity to index (e.g. SOFR) changes (=zero for fixed-rate bonds)
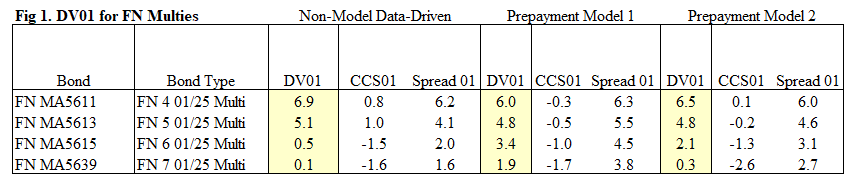
Let's look at the delta results produced by two leading prepayment models for FN Multi pools, alongside the results obtained from No-Model Data-Driven approach:
Observations from Fig 1:
- Results implied by data can be easily broken down using formula 1 above.
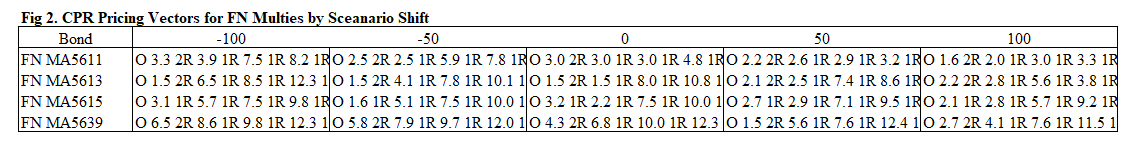
- These results can be obtained manually from any pricing screen, using data-driven prepayment vectors by scenario (see Fig 2).
- Prepayment Model 1 and Model 2 show different results (especially for higher coupons). Which one is correct – it is impossible to determine given "black model" nature of their design.
- For liquid products like those in Fig 1, we would use Trader Hedge Ratios or the Empirical approach (as described above). For less liquid bonds (Agency Derivatives, CMOs, MSRs), we prefer the No-Model Data-Driven method – it avoids subjective model assumptions, is unaffected by version changes, and offers greater transparency.
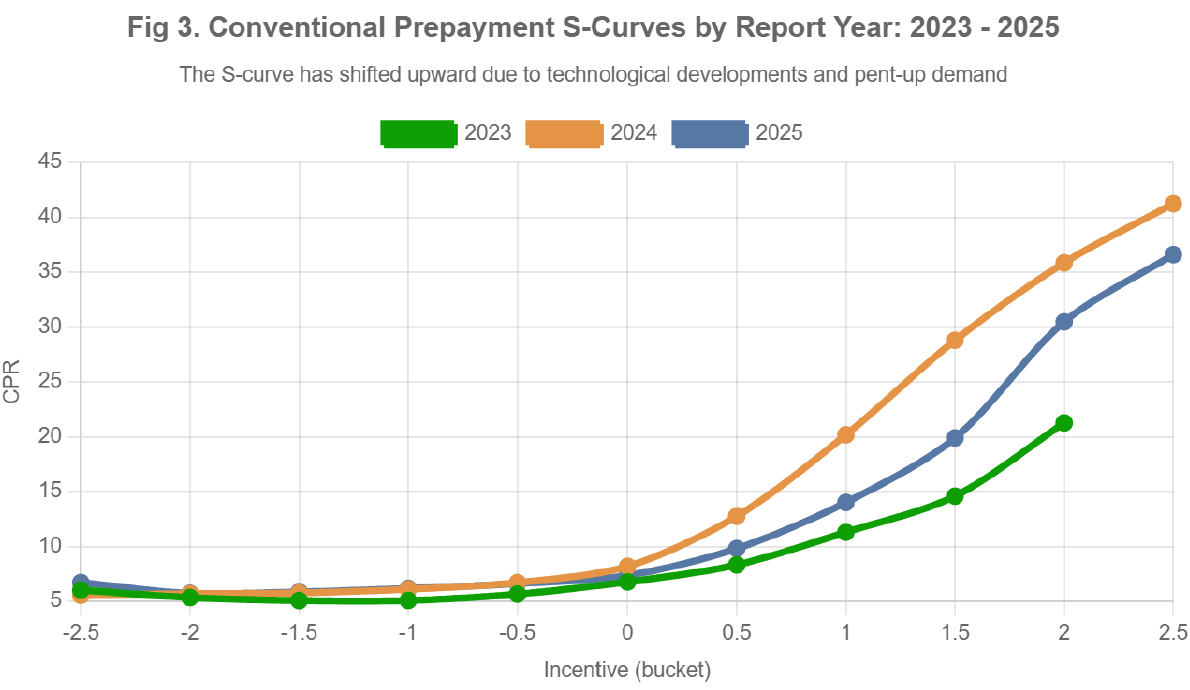
- Differences in delta obtained in Fig 1 arise from the level and shape of the S-Curve used to calculate Spread01 and CCS01. Although Prepayment Model 1 differs from Model 2 in delta materially, both use flatter and less negatively convex S-Curves. The reason for this is that S-curve has shifted upward due to technological developments and pent-up demand over the last few years. This can be easily verified with data analysis (see Fig 3). It's one reason why TBA Hedge Ratios and No-Model Data-Driven imply shorter durations than those produced by prepayment models – the market recognizes that prepayment models are "too long" currently.
Our data-driven valuation technology automates this process across all structured products, delivering the most accurate and consistent pricing and risk metrics in the industry. Let us know if we can help!
Why Choose Us?
With over 20 years of experience and a proven track record in data and analytics development, IVolatility serves more than 500 institutional clients and 130,000 retail customers. Now, we're bringing this expertise to MBS data and analytics.
Discover the benefits of using IVolatility solutions for Mortgages:
Got a question or a comment?
We're here to serve IVolatility users and we welcome your questions or feedback about the MBS data insights discussed in this post. If there is something you would like us to address, we're always open to your suggestions. Please let us know!
Previous issues are located under the News tab on our website.